Local Food Supply Chain: How Farms to Your Table Reduces Carbon Emissions in Summer
Discover our farm to table carbon footprint analysis: how local, seasonal sourcing cuts emissions vs. supermarket supply chains, with data, tables, and practical tips.
By La rédaction de GreenEats Zone
·10 min read·Updated
In this article
TL;DR
- Transport ('food miles') typically accounts for only 6–11% of a food product's total lifecycle emissions; production method and food type matter far more (source: Our World in Data / Poore & Nemecek, Science 2018).
- Buying seasonal produce from local farms or CSAs eliminates refrigerated long-haul transport, cold storage emissions, and excess packaging — three underrated carbon costs.
- Summer is the optimal window for local sourcing in temperate regions: peak-season produce requires no heated greenhouses, which can cut production-phase emissions by 30–50% compared to off-season greenhouse crops (source: ADEME).
- Farm-direct and farmers market purchases redirect an estimated 80–90 cents of every dollar to the producer, strengthening the economic viability of low-input farming systems (source: USDA ERS).
- A practical weekly CSA share or farmers market visit can reduce a household's food-related carbon footprint — particularly when it replaces air-freighted or greenhouse-grown supermarket imports.

The Food Miles Myth — and What Actually Drives Emissions
What does a real farm to table carbon footprint analysis reveal? Fewer than 11% of total food emissions come from transport — meaning where you buy matters less than how it was grown. The phrase "food miles" entered public consciousness in the 1990s and has shaped consumer intuition ever since. The idea is straightforward: the farther food travels, the more carbon it emits. Buy local, save the planet. The reality is more complicated — and more interesting.
A landmark 2018 study by Poore and Nemecek, published in Science, analyzed the full lifecycle of 40 food products across 119 countries. Their finding: transport accounts for roughly 6% of food's total greenhouse gas emissions globally. For most plant-based foods, that figure is even lower. The dominant drivers of food emissions are land use change, fertilizer application, methane from livestock, and energy use in production.
This does not mean food miles are irrelevant. It means they are only one variable — and often not the most important one. A locally grown tomato raised in a heated winter greenhouse in northern Europe can carry a larger carbon footprint than one shipped by sea from southern Spain (source: ADEME lifecycle analysis). Context is everything.
Where local sourcing does deliver a clear emissions advantage is precisely in summer, when seasonal alignment removes the need for energy-intensive workarounds entirely.
For a deeper dive into how food systems shape global emissions, see the Our World in Data food emissions overview — one of the most comprehensive public resources available.
Why Summer Is the Strategic Season for Local Sourcing
The Greenhouse Energy Premium
Out-of-season produce — tomatoes in January, strawberries in February, peppers in March — is either grown in heated or artificially lit greenhouses, or imported by air freight from distant growing regions. Both carry substantial carbon costs.
Heated glass greenhouses in northern temperate regions can consume between 20 and 50 kWh of energy per kilogram of tomatoes produced, depending on the heating system (source: ADEME). Natural gas heating remains the norm in many facilities, meaning off-season greenhouse tomatoes may emit several kilograms of CO₂-equivalent per kilogram of produce — comparable to some meat products.
In summer, a farm 30 miles from your kitchen requires none of that infrastructure. Sunlight is free, temperatures are adequate, and soil-grown crops produce at natural yields. The production-phase emissions are orders of magnitude lower.
Air Freight: The Hidden Spike
Air-freighted food is a relatively small share of global food trade by volume — roughly 1% by weight — but it accounts for a disproportionate share of food transport emissions. Air freight emits approximately 50 times more CO₂ per tonne-kilometer than sea freight (source: Our World in Data, drawing on Poore & Nemecek 2018). Products commonly air-freighted include asparagus from Peru, green beans from Kenya, and certain berries shipped to European and North American markets out of season.
In summer, domestic and regional equivalents are at peak availability. Buying a punnet of strawberries from a farm stand rather than one flown in from overseas is one of the clearest, most direct emissions trades a consumer can make.
Cold Chain Emissions
Supermarket supply chains maintain refrigeration continuously from farm through distribution center, transport vehicle, retail floor, and home delivery. Each stage adds energy consumption. A product spending 10–14 days in transit and cold storage accumulates refrigeration emissions that a farm-direct purchase — picked yesterday, driven 20 miles in an unrefrigerated van — simply does not.
Refrigeration accounts for approximately 1% of global greenhouse gas emissions when the full cold chain is counted (source: IEA, 2023 Cooling Report). For perishable produce moving through international supply chains, the cold chain contribution to per-product emissions is measurable and avoidable through local substitution.
Farm to Table Carbon Footprint Analysis: Breaking Down the Local Supply Chain

Farm to Farmers Market
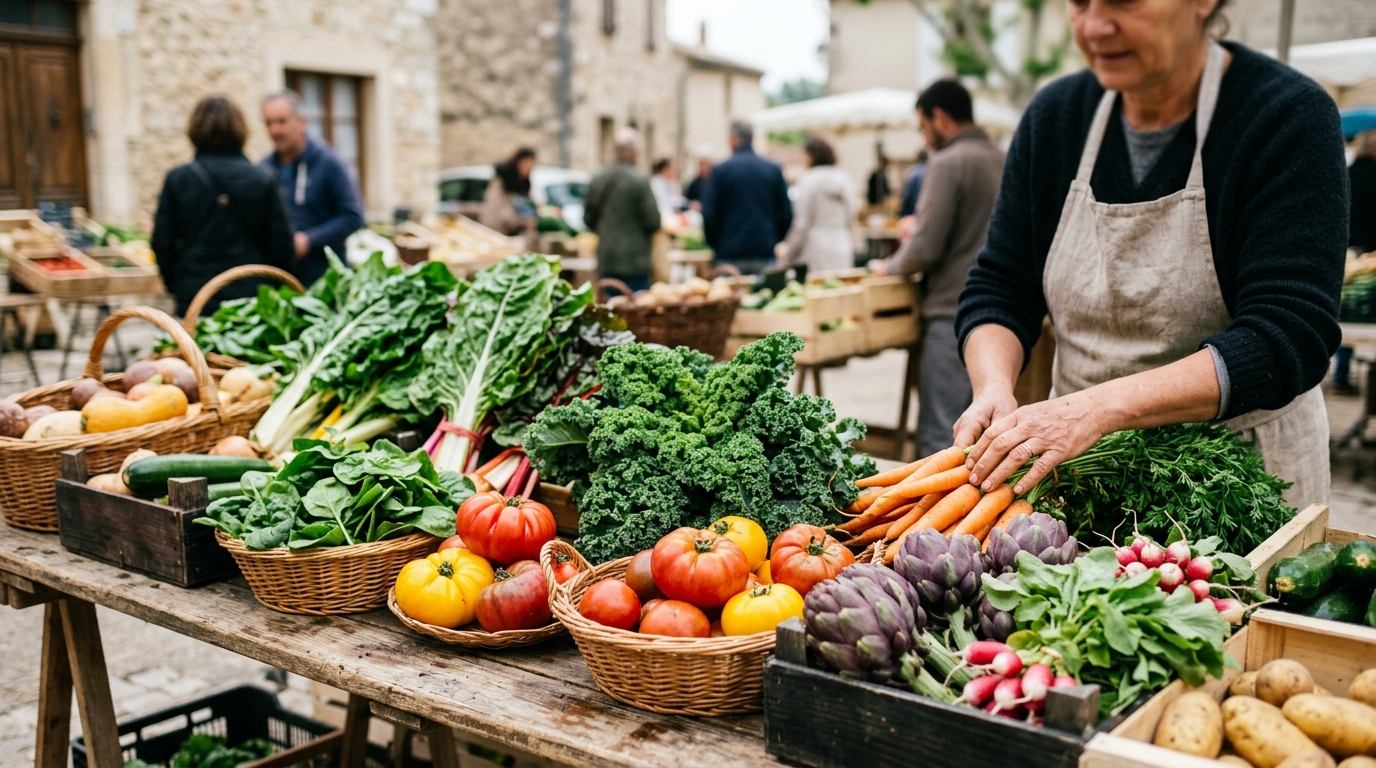
The farmers market model is among the most carbon-lean distribution systems for fresh food. A typical scenario: a grower harvests on Thursday evening, loads a light truck or van, drives to a Saturday morning market, and sells direct to consumers who have traveled — often on foot, by bike, or in a shared vehicle — to a central location.
Total supply chain steps: one transport leg, no intermediary warehouse, no refrigerated distribution center, minimal packaging. Compare this to a supermarket tomato's journey: harvest, field packing, refrigerated truck to regional packer, cold storage, refrigerated truck to distribution center, cold storage, refrigerated truck to store, retail refrigeration, consumer drive home.
The supermarket supply chain for fresh produce in the United States averages between 1,500 and 2,500 miles of transport (source: USDA Agricultural Marketing Service). A regional farmers market supplier may operate within a 50–150 mile radius.
CSA Shares: The Aggregation Advantage
Community Supported Agriculture (CSA) schemes aggregate deliveries efficiently. A single farm vehicle delivering 80 weekly boxes to a neighborhood drop point generates a fraction of the per-box transport emissions of 80 individual drives to a supermarket. The USDA counted more than 7,000 farms operating CSA arrangements in the United States as of the most recent Census of Agriculture (source: USDA NASS, 2022 Census of Agriculture).
Beyond emissions, CSA participation structures purchasing around what is actually in season, automatically steering households away from high-emission out-of-season imports.
On-Farm Purchases
U-pick operations — where consumers travel to the farm, harvest their own produce, and pay by weight — represent the most extreme compression of the supply chain. There is effectively no post-harvest handling, no packaging, and no distribution. The consumer's transport to the farm is the primary carbon variable, and a shared trip by a family or group of friends brings that per-pound figure very low.
Farm Direct vs. Supermarket: A Side-by-Side Carbon Comparison
Precise lifecycle figures vary by product, region, and production system, so the following comparisons use published ranges rather than point estimates.
| Product & Sourcing Scenario | Estimated CO₂e (kg per kg produce) | Key Driver |
|---|---|---|
| Summer tomatoes — local field, farmers market | 0.4–0.7 | Outdoor production, short transport |
| Summer tomatoes — supermarket, domestic peak season | 0.7–1.2 | Cold chain, distribution network |
| Tomatoes — heated greenhouse, off-season supermarket | 3.0–5.0 | Gas heating energy |
| Strawberries — local, in-season, farm stand | < 0.5 | Minimal inputs, direct sale |
| Strawberries — air-freighted, out-of-season | 5.0–10.0 (transport alone) | Air freight multiplier |
| Beef (reference, any season) | 20–30+ | Land use, methane |
Sources: ADEME agri-food lifecycle database; Our World in Data / Poore & Nemecek, Science 2018.
The lesson: seasonal alignment with local sourcing is where the emissions benefit concentrates. Buying a local tomato in July is very different from buying a local tomato in December — and the supply chain behind each is entirely different.
How to Find Local Sources This Summer
The infrastructure for local food sourcing has expanded considerably over the past decade. Here are the most reliable channels.
Farmers Markets
The USDA's Agricultural Marketing Service maintains a national farmers market directory at ams.usda.gov. As of 2023, more than 8,000 farmers markets operate across the United States (source: USDA AMS). Most list vendor types, accepted payment methods (many now accept SNAP/EBT), and seasonal schedules.
When shopping, prioritize vendors who grow what they sell. Ask directly: "Did you grow this?" Genuine farmers can usually answer detailed questions about their growing practices.
CSA Subscriptions
LocalHarvest.org and the USDA's directory both list CSA farms by zip code. Most summer shares run from June through September, with weekly or biweekly box delivery or pickup. Pricing typically ranges from $25–$45 per week for a standard family share, though this varies significantly by region and farm.
Look for farms that describe their soil management practices, use of cover crops, and approach to synthetic inputs — lower-input farms tend to have lower overall emissions profiles.
Ready to start reducing your household's food footprint this season? Explore local CSA farms and seasonal sourcing guides on our resource hub to find options near you.
In-Season Produce Calendars
Seasonal availability varies by USDA hardiness zone. For consumers in temperate North America, summer (June–September) brings:
- Tomatoes, peppers, eggplant, zucchini, cucumbers (July–September peak)
- Corn, green beans, summer squash (July–August)
- Peaches, plums, blueberries, blackberries (June–August, zone-dependent)
- Basil, chard, kale, lettuces (June–July before heat bolting)
State agricultural extension offices publish free seasonal calendars specific to local growing regions — a more reliable resource than generic national guides. You can also browse our seasonal eating guides by region for zone-specific recommendations.
On-Farm Purchases
Farm websites, Instagram accounts, and platforms like Barn2Door allow consumers to order directly from farms for pickup or local delivery. Some farms offer surplus produce at reduced prices mid-season — a practical way to access high-quality local food while reducing farm-side food waste.
The Bigger Picture: What Local Sourcing Can and Cannot Fix
Local sourcing is a meaningful lever, but it operates within a broader emissions landscape. Food systems account for approximately 26% of global greenhouse gas emissions (source: Poore & Nemecek, Science 2018). Of that, animal agriculture — particularly beef and dairy — represents the largest single category by a significant margin, regardless of where the animal was raised.
A consumer who switches from imported greenhouse tomatoes to local field tomatoes makes a real improvement. A consumer who also reduces beef consumption by one or two meals per week makes a larger one. These choices are not in competition — they compound.
Local and seasonal sourcing is most powerful when it operates alongside dietary shifts toward lower-emission foods, reduction in household food waste (which the USDA estimates at 30–40% of the food supply by weight, source: USDA ERS), and engagement with farms that use regenerative or low-input production practices.
Summer offers a rare alignment: the season when local, seasonal, and low-carbon all point in the same direction. The practical ask is modest — a weekly market visit, a CSA box, or a farm trip — and the cumulative impact across a household's food decisions is real.
FAQ
Q: Does buying local food always mean lower carbon emissions?
A: Not automatically. If a local farm uses energy-intensive methods — heated greenhouses, heavy synthetic fertilizer use, or diesel-intensive irrigation — its emissions can exceed those of an efficiently managed distant farm. The biggest emissions gains from local sourcing come when local is also seasonal, meaning the crop is grown outdoors during its natural growing period without artificial climate control.
Q: What are food miles, and how much do they actually matter?
A: Food miles measure the distance food travels from farm to consumer. They are a useful shorthand but an incomplete metric. According to the Poore and Nemecek lifecycle study published in Science (2018), transport accounts for roughly 6% of global food emissions on average. Production method — especially land use and energy inputs — is typically the dominant factor. Food miles matter most when air freight is involved, since flying food emits approximately 50 times more CO₂ per tonne-kilometer than sea shipping (source: Our World in Data).
Q: How do I find a CSA near me this summer?
A: The USDA's Local Food Directories tool (ams.usda.gov/local-food-directories) and LocalHarvest.org both allow searches by zip code. Many CSAs begin summer shares in June; some have waitlists, so contacting farms in April or May is advisable. The USDA counted more than 7,000 CSA-operating farms in the 2022 Census of Agriculture (source: USDA NASS).
Q: Is farmers market produce always more expensive than supermarket produce?
A: It varies. Some items — heirloom tomatoes, specialty greens, artisan products — carry a premium. Staple summer produce (zucchini, corn, cucumbers) is often competitively priced at peak season, sometimes cheaper than supermarkets due to the absence of distribution markups. Many markets now accept SNAP/EBT, and some operate SNAP-matching programs that effectively halve the cost of purchases for qualifying shoppers.
Q: Which summer foods have the biggest carbon footprint at the supermarket?
A: Out-of-season produce grown in heated greenhouses (tomatoes, peppers, cucumbers) and any fresh produce shipped by air freight carry the highest emissions relative to their local, in-season alternatives. Beef and lamb remain the highest-footprint foods overall regardless of season (source: Poore & Nemecek, Science 2018), but within the produce category, the greenhouse and air-freight variables are the clearest targets for summer substitution.
Q: Can one household's food choices actually make a difference?
A: At individual scale, food choices are among the highest-impact lifestyle levers available. Estimates from Poore and Nemecek (2018) suggest that moving from an average Western diet to a plant-rich, low-waste diet can reduce an individual's food-related emissions by more than half. Shifting summer purchases toward local, seasonal, farm-direct channels is a concrete, repeatable action that aggregates — across millions of households — into meaningful demand signals for lower-emission farming systems.
GreenEats Zone est édité par ENN Consulting SAS
Recommended reads
More in Local sourcing and seasonal food →
Plant-based diet environmental impact comparison
How much lower is the carbon footprint of a plant-based diet environmental impact comparison vs meat? Data-driven analysis by food category, with lifecycle figures and guidance.
Local Farm Certification Labels Explained (2026)
Not all farm labels mean the same thing. Learn which local farm certification labels explained here actually guarantee freshness and sustainability in 2026 — verify them fast.